Decoded by Galvor · Issue #2
False Bangers: Why Your Best Hook Isn’t Always Your Best Ad
A strong hook gets people to stop scrolling. It doesn’t tell you who will buy it. We looked at hook data across industries to see where the two parts were.
By Raj Dhakad, Founding Engineer, Galvor · Updated
Key takeaways
- A great hook is not a guarantee. Of every 10 ads with the best hooks, 4 still cost more per order than a typical ad.
- Hook rate tells you very little about sales. On its own, it explained about 1% of the difference in cost per order between ads.
- High-hook ads win clicks but lose buyers. As hook rate goes up, more people click, but fewer of them buy.
- What you show early matters. Ads that showed the product early, or showed it working, were more likely to sell, even when fewer people stopped to watch.
Tuesday, 10:15 a.m.
Sam, our growth lead from Issue #1, opens the weekly creative report. One ad is far ahead of the rest. Almost 4 in 10 people who saw it stopped scrolling. Nothing else came close.
The team WhatsApp group lights up. “That’s the one. Double the budget. Brief three more like it.”
Two weeks later, the numbers are in. Lots of people watched, and lots clicked. Very few bought. The cost per order is the worst in the account.
The ad didn’t fail at the hook. It failed after the hook, and the dashboard never showed it.
Why a strong hook can fool you
Hook rate is the share of people who watch at least the first 3 seconds of an ad. It is the first number most teams look at, because it comes in fast and it is easy to compare.
But it only measures one thing: did people stop scrolling? It does not tell you:
- whether they kept watching,
- whether they clicked,
- or whether the people who clicked were ready to buy.
Some openers are very good at stopping the scroll and very bad at finding buyers. A shock line, a joke or a question that has little to do with the product can pull in the wrong crowd. We call these ads false bangers: big on attention, weak on sales.
The question is how often this happens. So we checked.
What the data showed
We looked at video ad data across industries. Four things stood out.
1. A great hook is not a sure thing. We took the quarter of ads with the best hook rates. 41 out of 100 still had a higher cost per order than a typical ad. A strong hook helps your odds a little, but four in ten still lose.
2. Hook rate barely predicts sales. On its own, hook rate explained about 1% of the difference in cost per order between ads. How long people kept watching explained a little more, about 4%. What happened after the click explained by far the most.
3. High-hook ads win clicks but lose buyers.
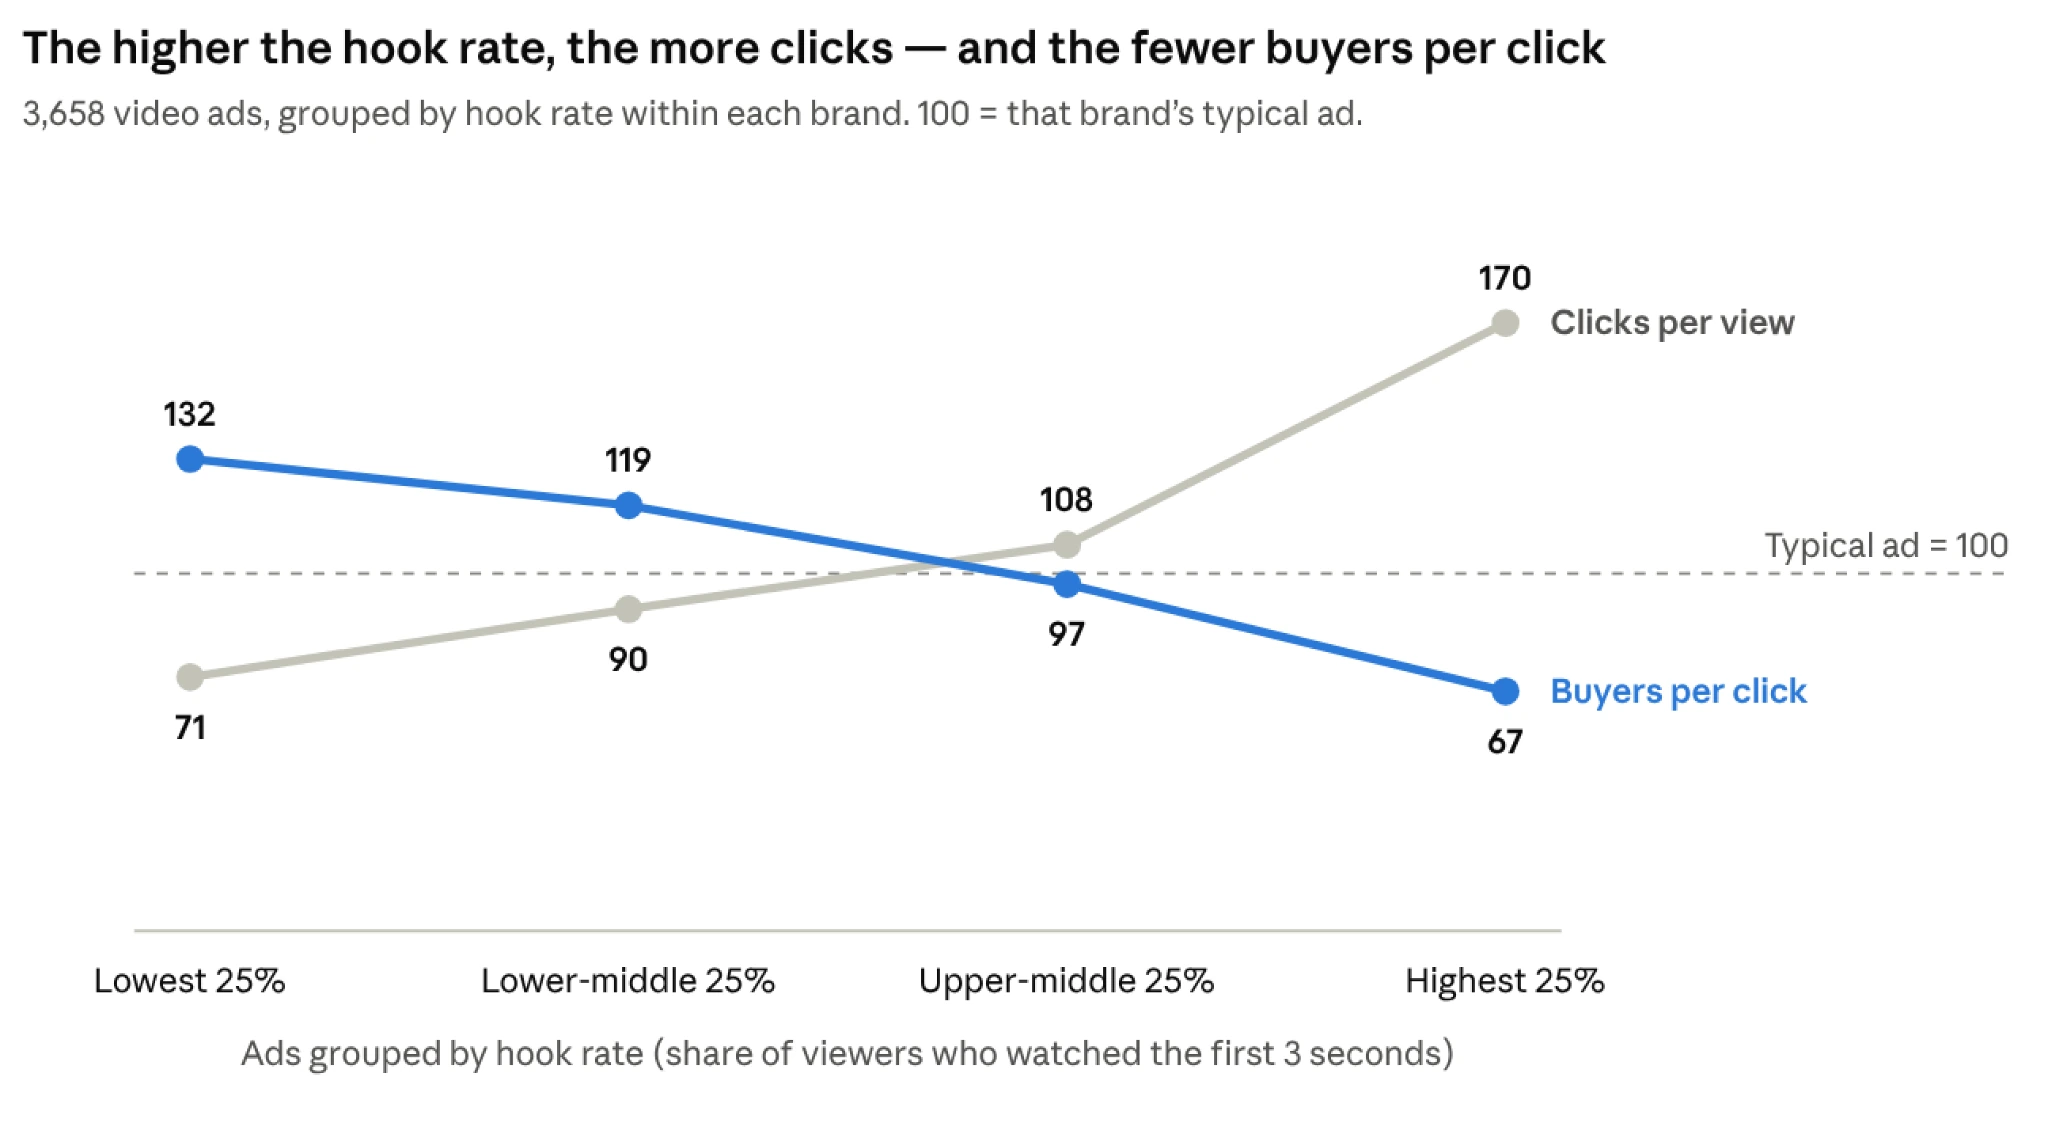
Ads with the highest hook rates got 70% more clicks for every view than a typical ad. But of the people who clicked, about a third fewer bought. The cost of reaching people stayed about the same. This held across the board.
4. False bangers lose the sale after the click.
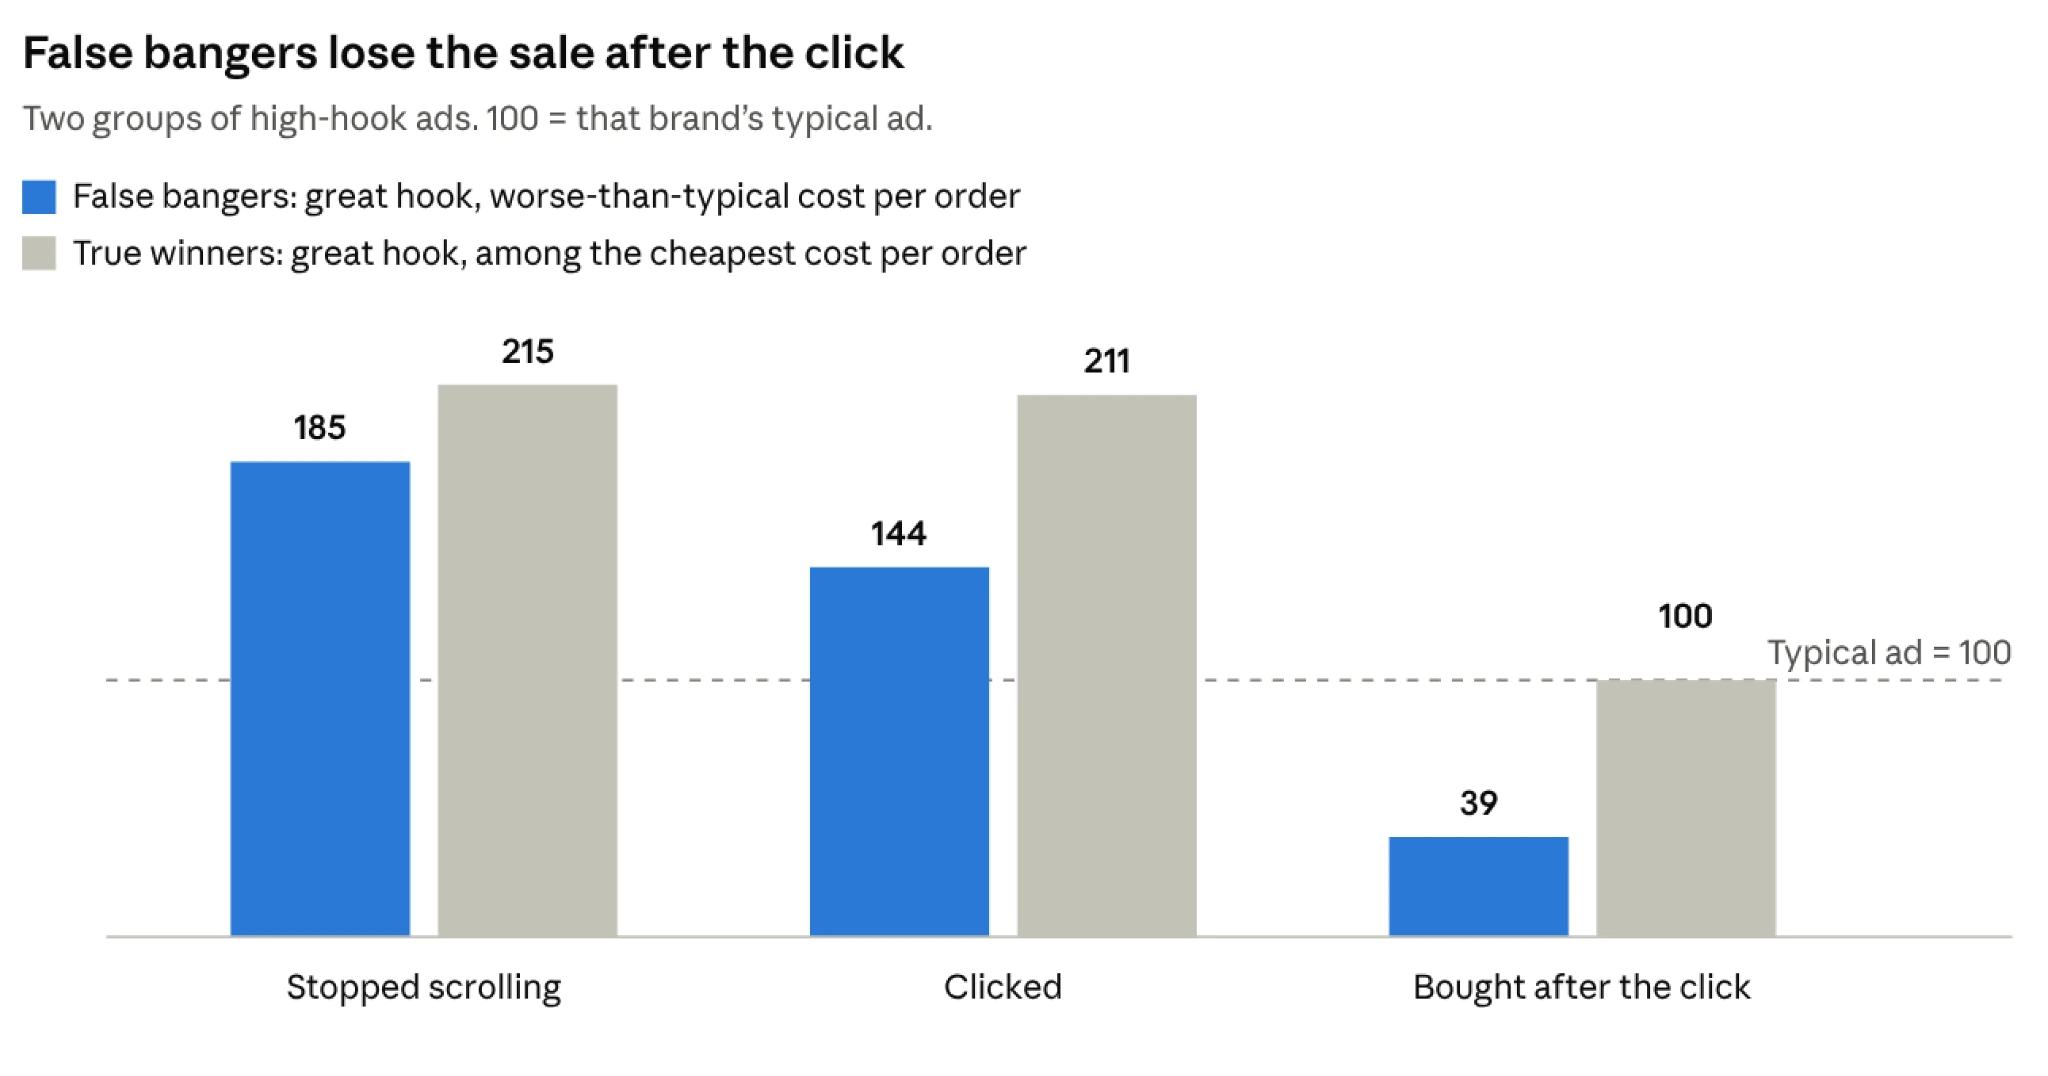
Both groups stopped the scroll about twice as well as a typical ad. The big gap opens after the click. False bangers turned clicks into sales at less than half the rate of a typical ad. True winners converted at a normal rate, and with their extra clicks that made their orders cheap.
In plain terms: the opening caught attention, but often from people who were never going to buy.
What a hook that sells looks like
If a hook only counts when it leads to a sale, what do the hooks that sell have in common? Three patterns showed up across brands.
Show the product early, even if fewer people stop. Ads that put the product on screen in the first 3 seconds had a lower hook rate. But they were more likely to beat a typical cost per order, by about 16 ads in every 100. Saying the brand name early worked the same way. Fewer people stopped, but more of the people who stopped were buyers.
Show the product working, not just talked about.
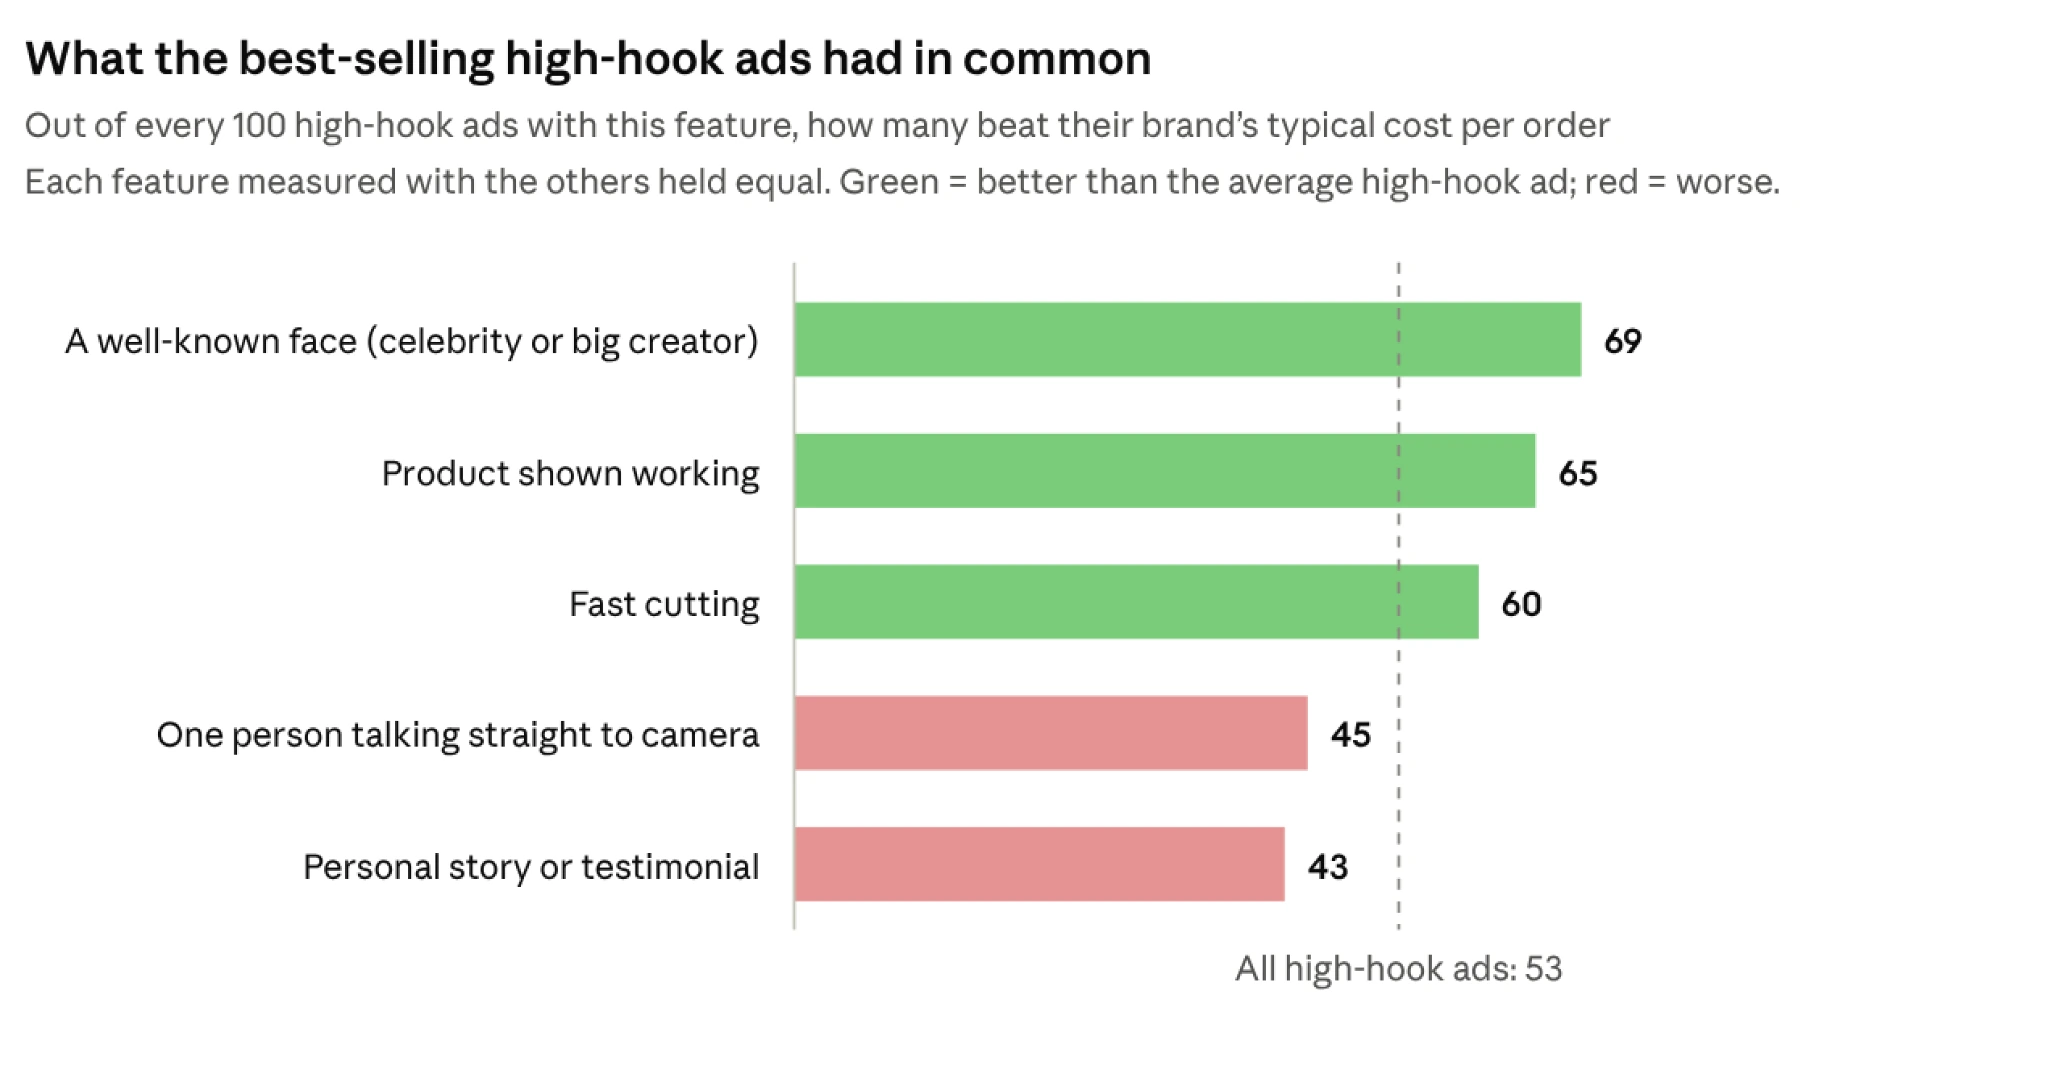
Among ads that already had strong hooks, a few features made a cheap order more likely:
- Showing the product being used or demonstrated lifted the odds from 53 to 65 in 100.
- A well-known face and fast cutting also helped.
- One person talking to camera and personal stories did worse than average, even with a strong hook.
Three openings that sold. Three kinds of openings did well at both jobs. More people stopped scrolling, and orders cost less.
1 Start in the middle of the action, and save the answer for later
- 20%
- lower cost per order
- 63 in 100
- beat a typical cost per order
- 1.6×
- the typical hook rate
Not this: a face asking the question
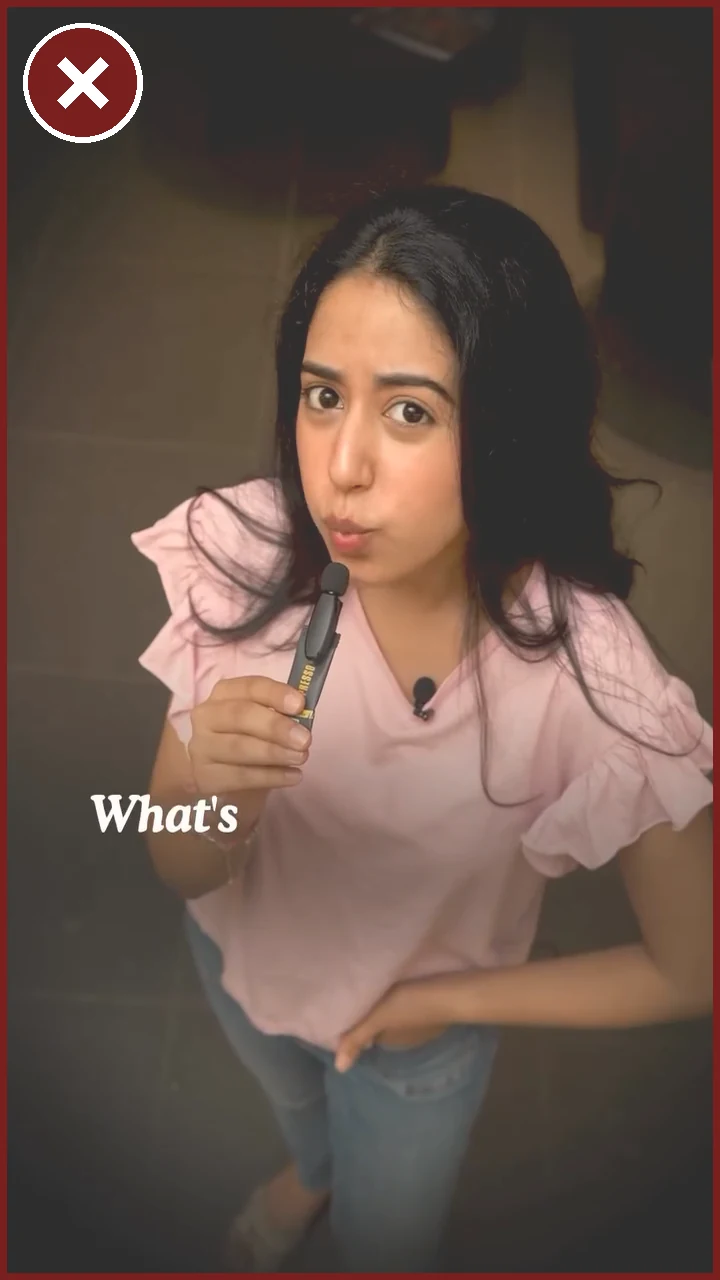
This: start mid-action
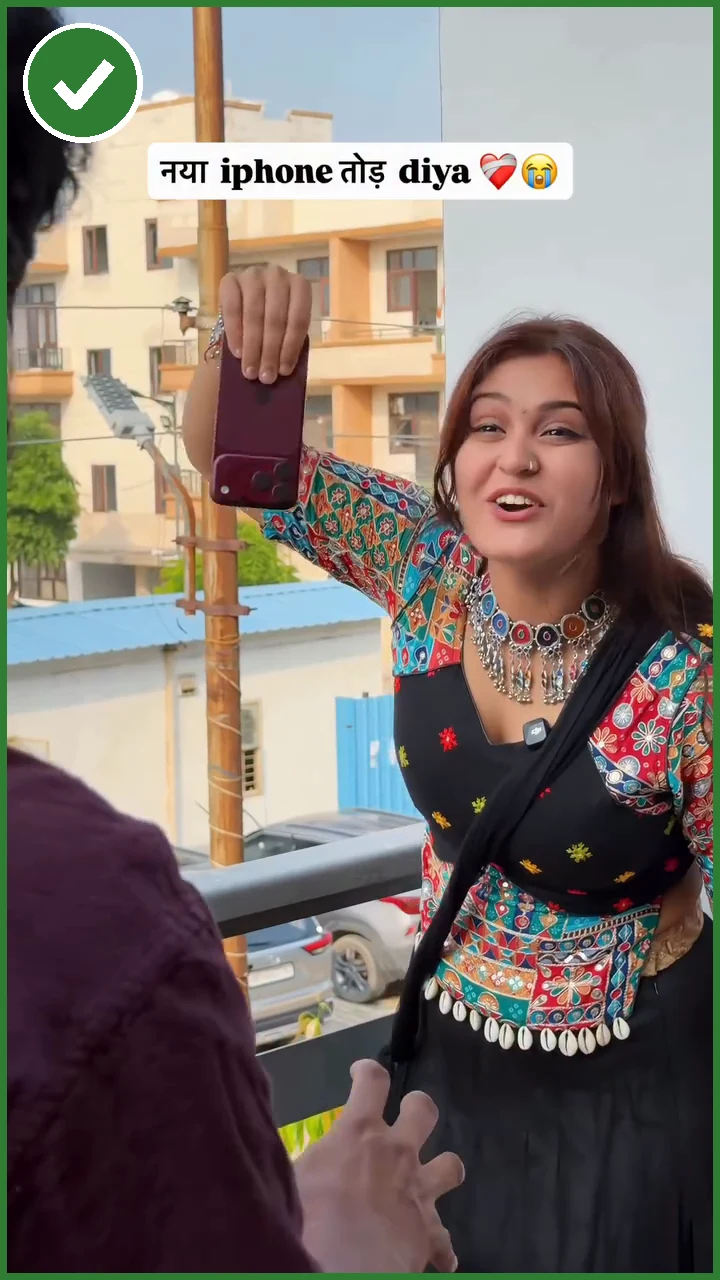
2 Start in the middle of the action, and keep it light or funny
- 19%
- lower cost per order
- 63 in 100
- beat a typical cost per order
- 1.9×
- the typical hook rate


3 Act out the problem as a short scene, instead of explaining it to camera
- 16%
- lower cost per order
- 60 in 100
- beat a typical cost per order
- 1.7×
- the typical hook rate
Not this: explain the problem to camera
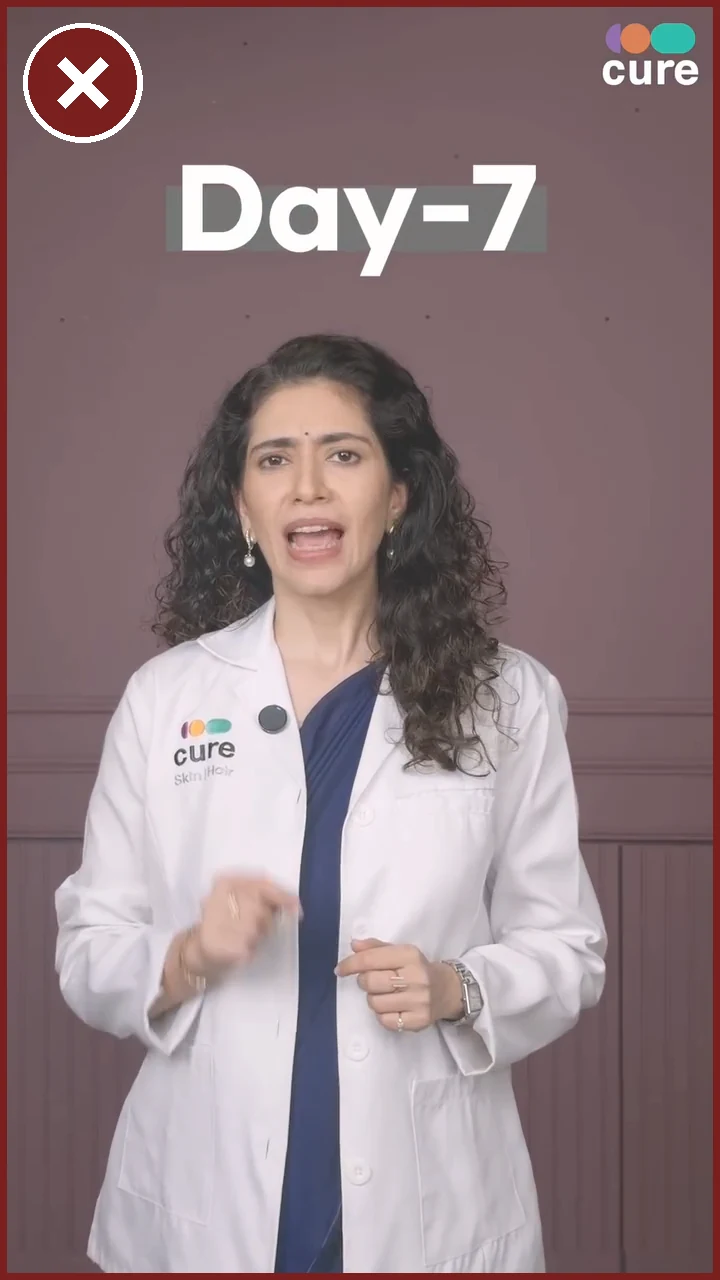
This: act the problem out
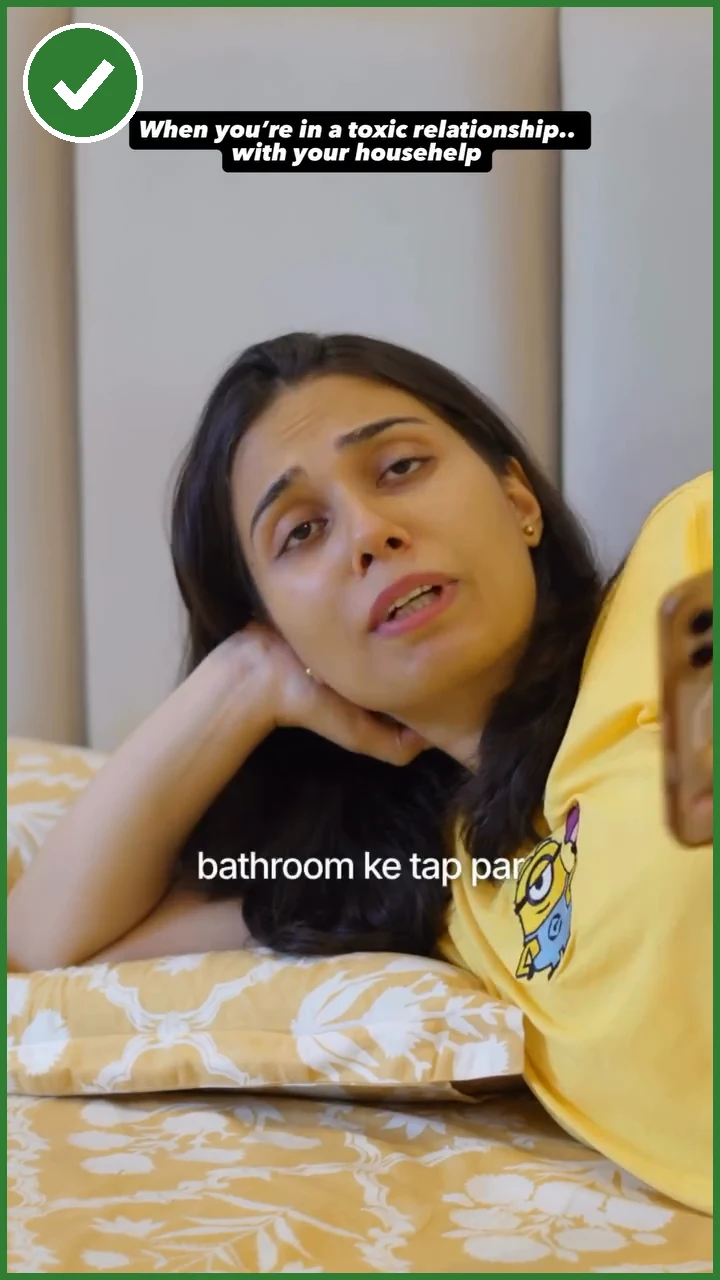
Cost per order is compared with other ads from the same brand. Among other ads, 49 in 100 beat a typical cost per order. Example frames are from public Instagram reels, picked because their opening matches each type. They show the style only; we have no results for these reels.
A simple check before you scale an ad
Don’t judge an ad on one number. Follow the customer through four steps, and compare each step with your typical ad:
- Stop: did people stop scrolling? (hook rate)
- Watch: did they keep watching? (share who watched to the end, or most of the way)
- Click: did they click? (click-through rate, or CTR)
- Buy: did the people who clicked buy? (conversion rate after the click)
The rule: never scale an ad on hook rate alone. If an ad is strong on steps 1 and 3 but weak on step 4, it is attracting the wrong people. More budget will not fix that. A better match between the opening and the product will.
The good news from our data: budgets mostly found the right ads. False bangers took only about 2% of total spend. The bigger risk is the lesson your team takes away.
When the next brief says “make more like that one”, make sure “that one” actually sold.
Three questions to ask your team this fortnight
- Of our five highest-hook ads last month, how many also had a below-average cost per order?
- When an ad gets lots of clicks but few sales, what do we change: the budget, or the opening?
- Do our briefs say “make more like that one” about ads that got attention, or about ads that sold?
If the answer to any of these is “not sure”, you may be copying the wrong winners.
Next issue: 30 ads, one ad
Meta’s ad system now groups ads that look alike and treats them as one. So making more ads only helps if they are truly different. We’ll show how to tell a tired ad from one that never got a fair chance.
Want to know which of your high-hook ads are losing buyers after the click? Talk to the founders about a read-only creative audit. We decode your recent ads and show you three things: which high-hook ads actually sold, where the others lost buyers, and what your best sellers do in their first 3 seconds.
How we did this
The data: anonymised video ad data across industries, run on Meta between mid-2025 and October 2026. Results are pooled, so no one brand is shown.
What “typical” means: the middle ad, where half of ads did better and half did worse.
What we can and can’t say: Meta decides who sees each ad, so these are patterns, not proof of cause. We treat each one as something to test in your next round of ads.
Sources
- Galvor analysis of anonymised industry ad data (pooled), October 2026
- Search Engine Journal (Oct 2026), Meta’s new terms expand crawling rights beyond advertisers
- Search Engine Land (Mar 2026), Meta introduces click and engage-through attribution updates
- Previously in Decoded: Issue #1, The Creative Memory Gap: Why Your Ads Keep Starting From Zero