Decoded by Galvor · Issue #5
Your Buyers Already Wrote Your Next Ad
Most creative reports tell you what an ad shows. Few tell you why people bought. Here’s how to find out.
By Raj Dhakad, Founding AI Engineer, Galvor AI · Updated
Key takeaways
- A tag like “founder story” describes the ad. It tells you nothing about the buyer. Two ads with the same tag can sell for different reasons, or not sell at all.
- One idea does hold up: ads that speak to the buyer’s moment work better. Not by magic, but reliably.
- The reason to buy is in the comments. Most comments are noise, so look for the few that ask a question or want proof.
Monday, 9:40 a.m.
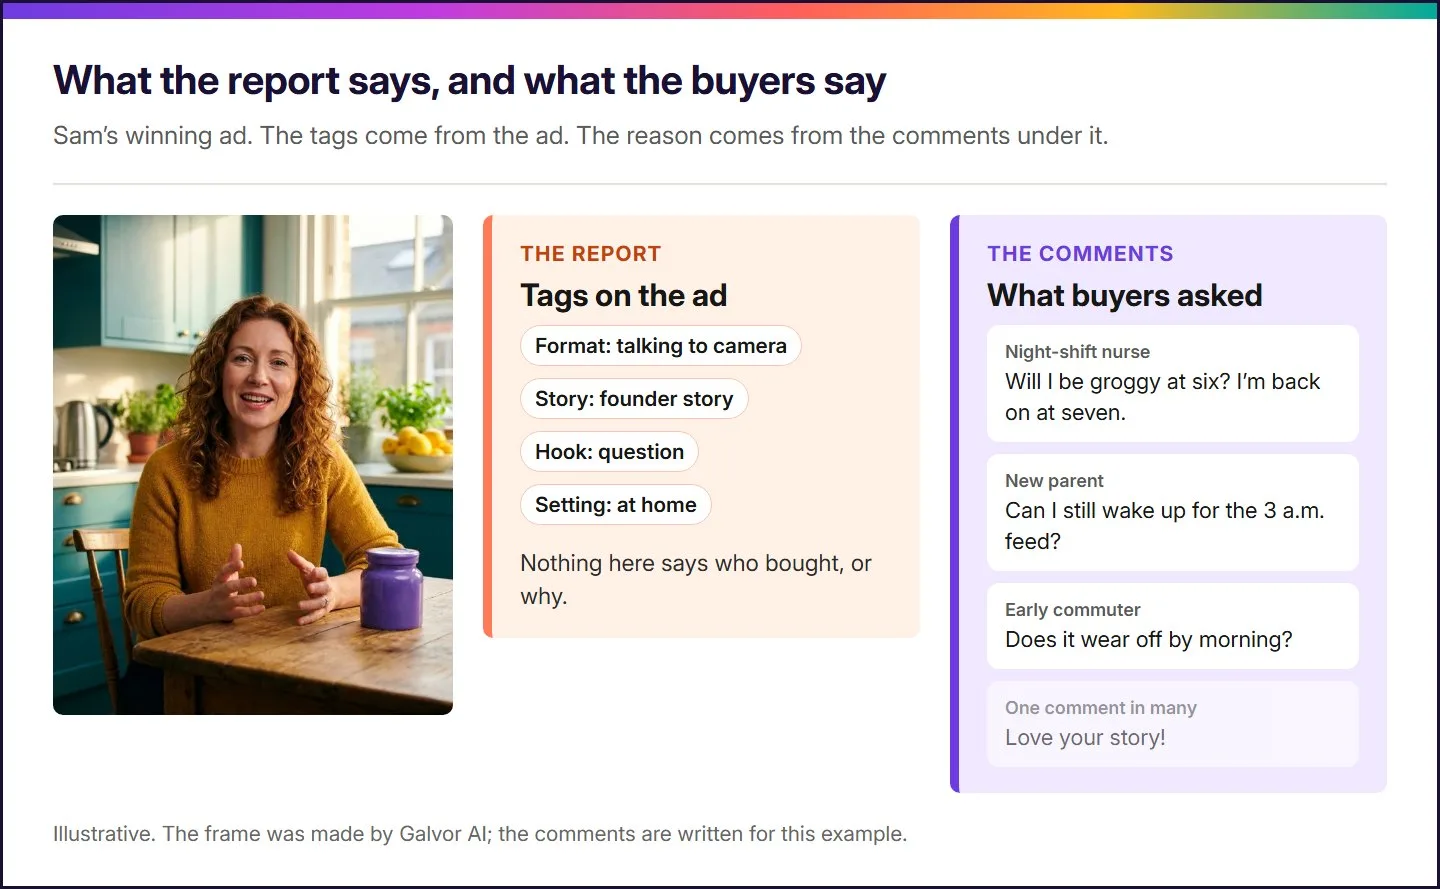
Sam, our growth lead from Issue #2 and Issue #3, opens the creative report. One ad has carried the account for six weeks. The report gives it two tags. Format: talking to camera. Story: founder story. In it, the founder sits at her kitchen table and explains why she started a sleep supplement brand.
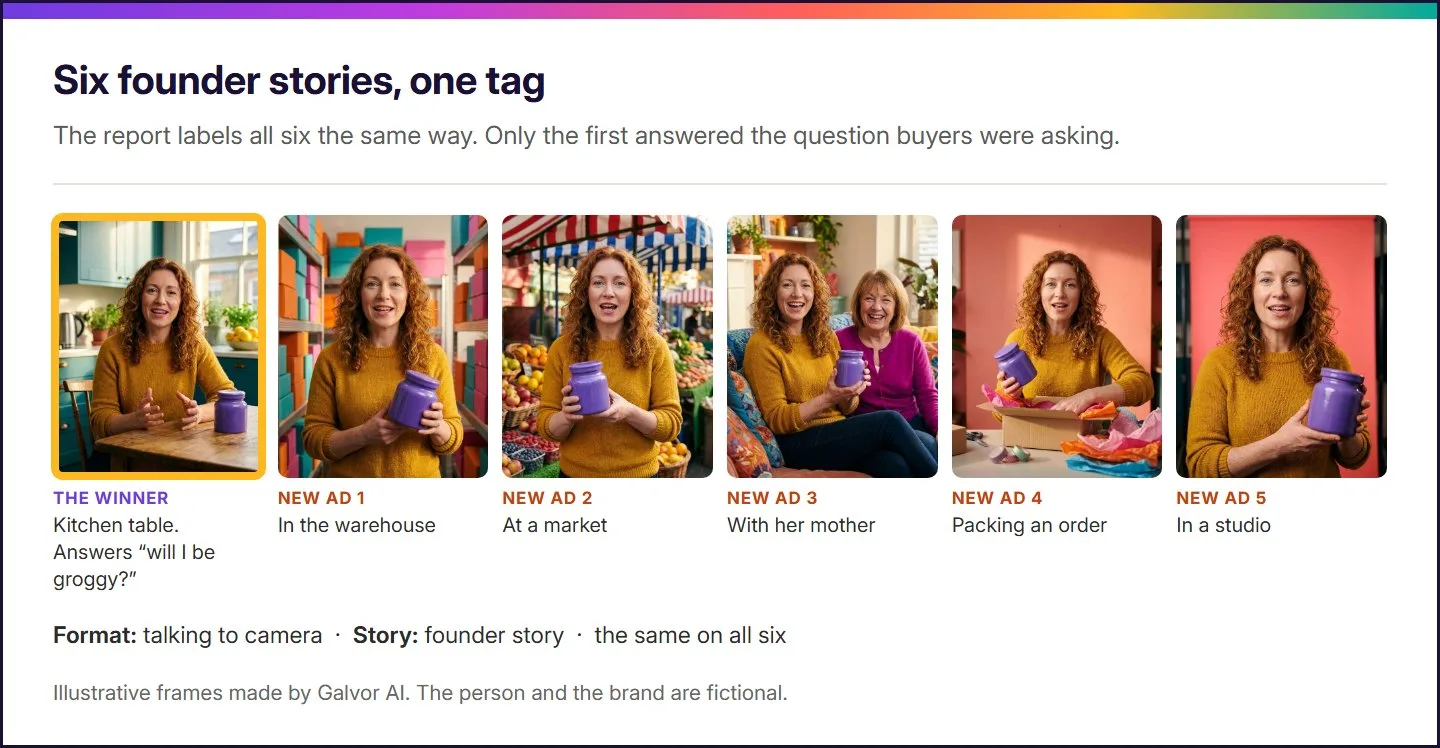
The agency reads the tags and does the sensible thing. It shoots five more founder stories: in the warehouse, at a market, with her mother. Two weeks later, none of the five is getting any real budget.
Then Sam reads the comments under the original. Hardly anyone mentions the founder. Nurses and new parents keep asking the same thing: will I be groggy at six? The winner answered that in one line. The five new ads never did.
Five more founder stories. One reason to buy, and it wasn’t the story.
Three ways to read an ad
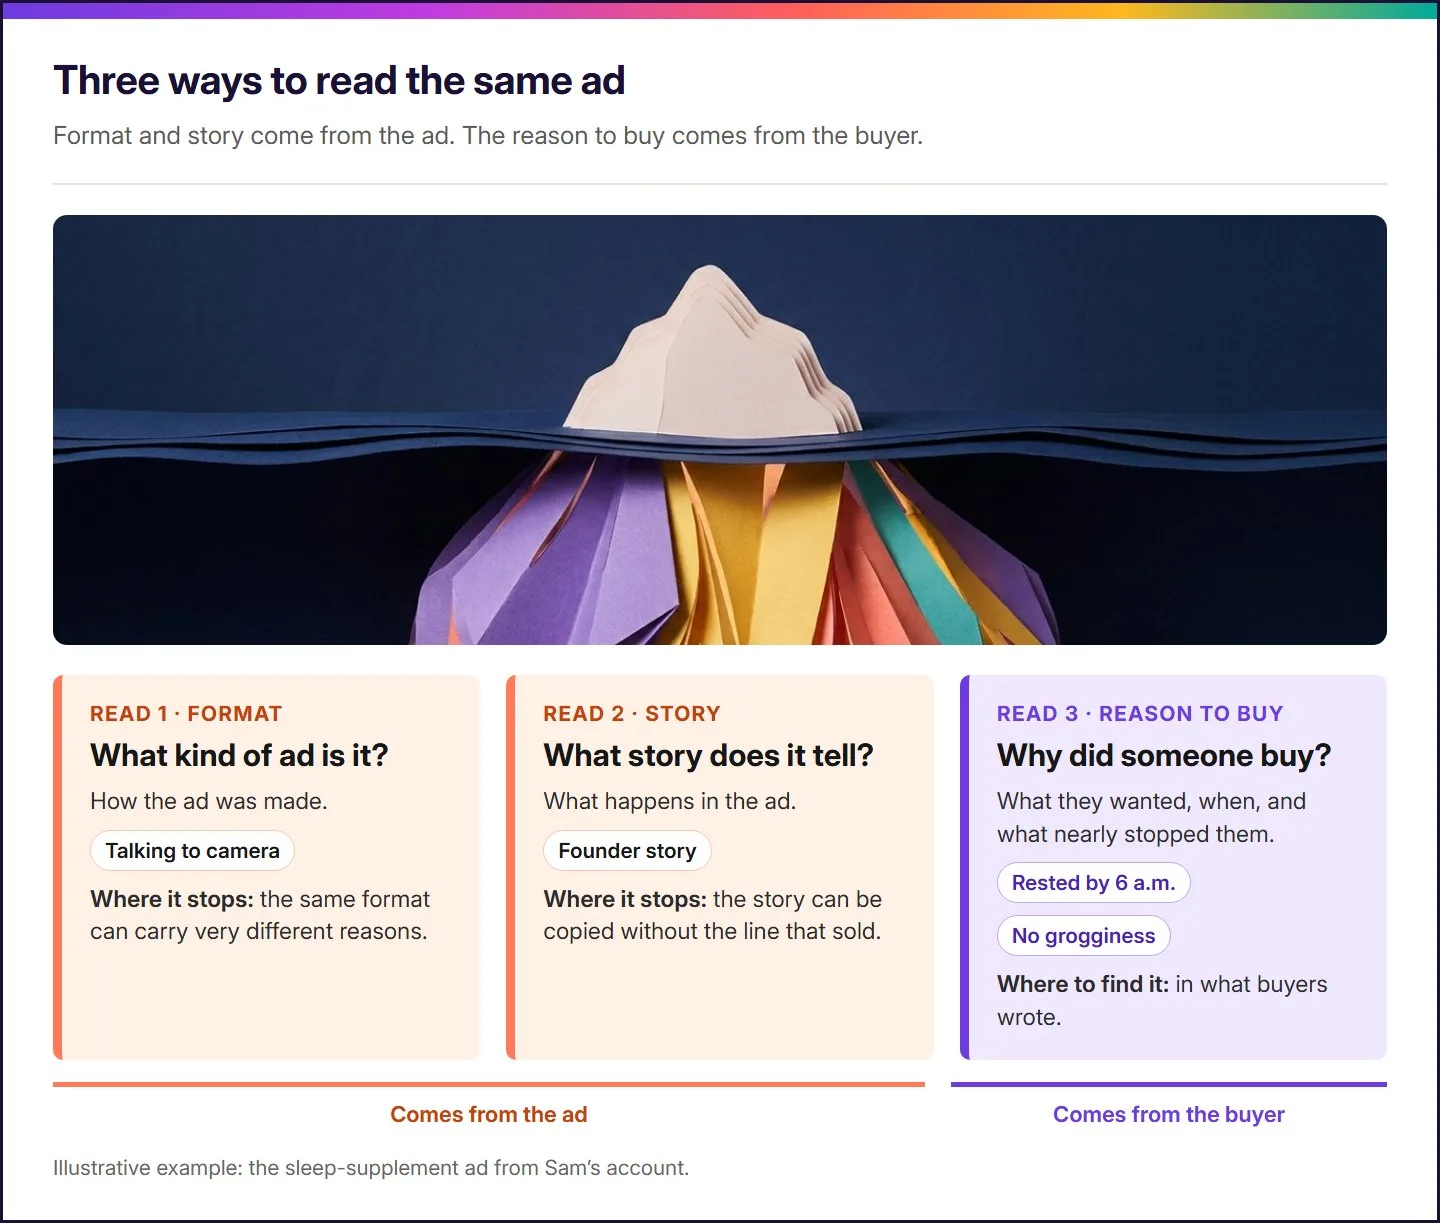
- Format is how the ad was made. Talking to camera, demo, skit. Two ads in the same format can give completely different reasons to buy. One brand can argue two things at once: when Galvor sampled 100 ads from a menswear brand’s public library, 44% argued price and 44% argued comfort.
- Story is what happens in it. Founder story, routine at home, problem then solution. You can copy a story exactly and still lose the one line that sold.
- Reason to buy reads the buyer. What they wanted, when they needed it, what nearly stopped them. You can’t get this from the ad. You have to read what buyers wrote.
The part the tools can see
Creative tools have moved fast here, and they deserve credit. Atria tags who an ad is for, what it promises and the feeling it goes for. Motion and Foreplay tag who the ad is meant for too.
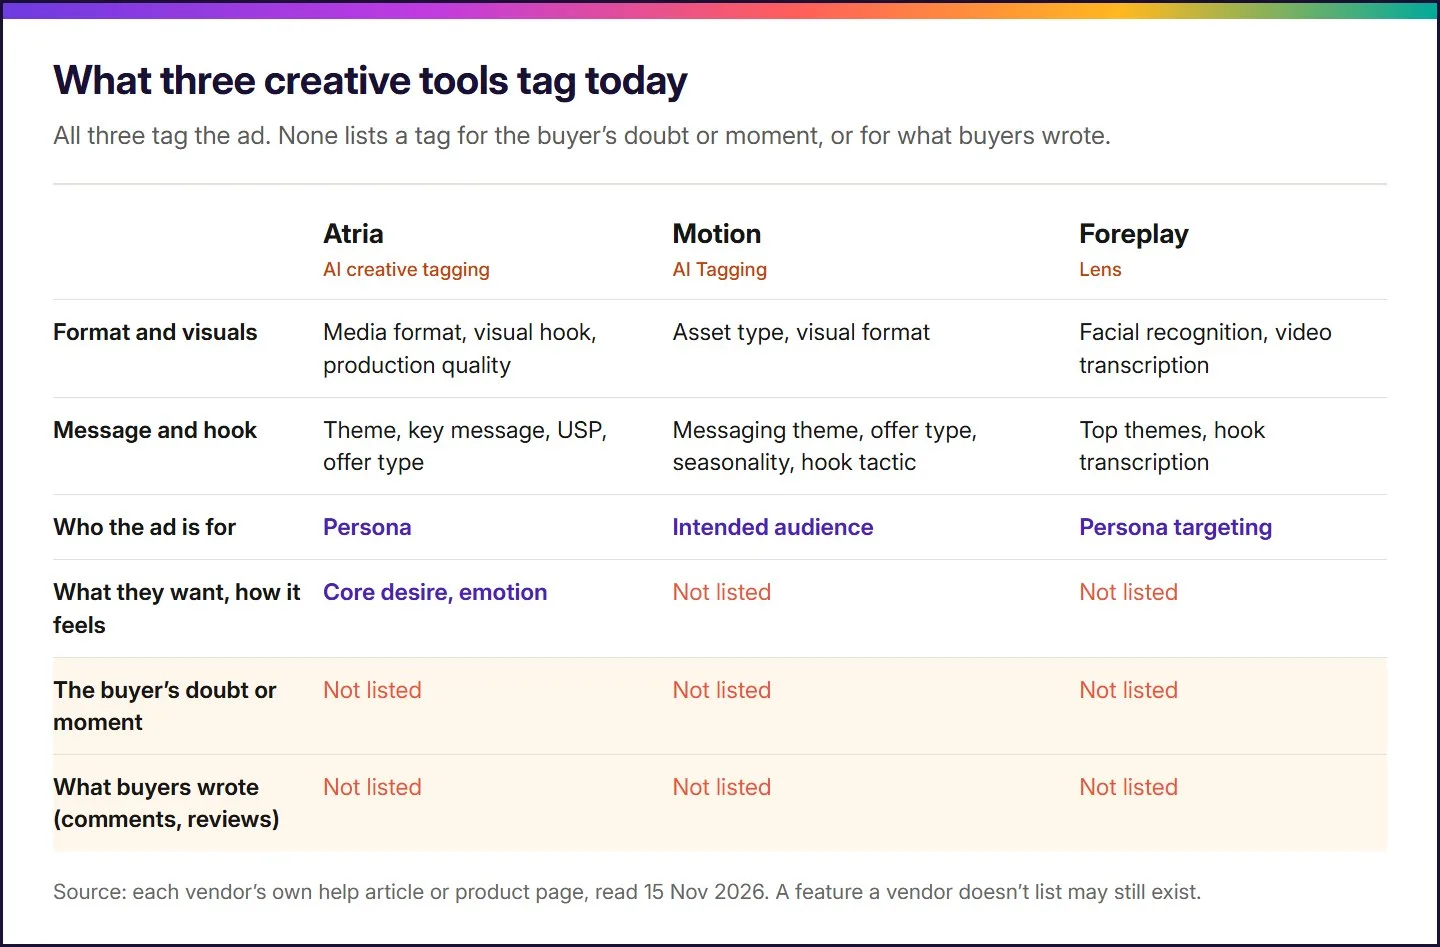
Source: Atria, Motion and Foreplay help and product pages, read 15 Nov 2026
All of these tags come from the ad itself. These tools tell you what the ad says. They can’t tell you what buyers wanted.
That matters more as teams make more ads. In Motion’s 2026 benchmark of 578,750 ads, about 5 in 100 were winners, and those winners took 55% of the spend. Making ads keeps getting cheaper. Knowing why the few winners won doesn’t.
What people get wrong about why we buy
Three lines you hear in every marketing meeting:
- “95% of buying decisions are subconscious.” The number comes from a line about all thinking, not about buying.
- “People buy on emotion and justify with logic.” A sales saying. In a study of more than 2,000 car ads, plain facts sold cars too.
- “Sell to the reptile brain.” Brain scientists dropped that idea long ago.
One idea holds up in the research: ads that match the buyer’s moment persuade more than ads that match who they are. The effect is real, but small.
Knowing why people buy won’t pick your next winner. It tells you which tests are worth running.
What Galvor found in the comments
So where do you find the reason to buy? In the comments. But you have to dig.
When Galvor read 7,854 comments on one brand’s posts, 91% said nothing about the product. Another 4.7% praised it. Only 3% showed someone who wanted to buy. The comments that tell you something are a thin slice, which is why most teams skim past them.
That was one brand. For another, a skincare brand we work with, Galvor read more than 14,700 comments. Two requests came straight out of them:
“Use it for a month, then show us.” “Prove the SPF.”
Ideas Galvor pulled from 14,700+ comments about a skincare brand
Buyers weren’t asking for a better story. They were asking for proof from real use.
The brand’s own posts pointed the same way. Posts with a real reaction, like a comedian’s take or “a gift I was sent”, got 2.7 engagements per 100 views. The account’s usual is 0.98. Posts that used clinical numbers as proof got 0.43, less than half the usual.
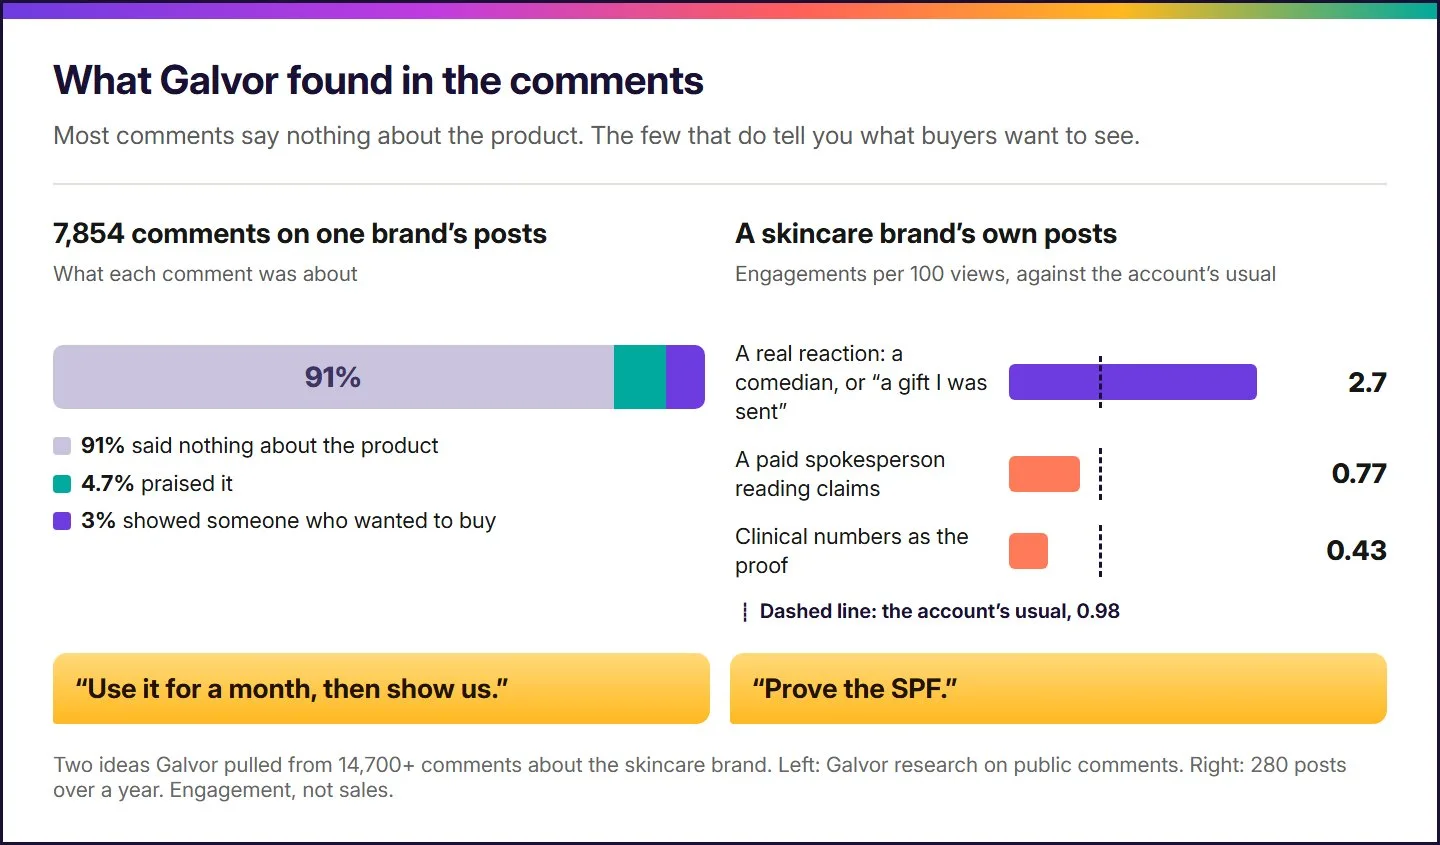
Source: Galvor research on public comments (left); Galvor’s read of a skincare brand’s 280 Instagram posts over a year (right). Engagement, not sales.
This is engagement, not sales, and it is one brand. We’re not showing a before-and-after here. But it is the pattern this issue is about. The brand’s ads mostly opened on an aspiration. Its buyers were asking for proof.
Four things to look for
When you read the buyer’s side, look for four things.
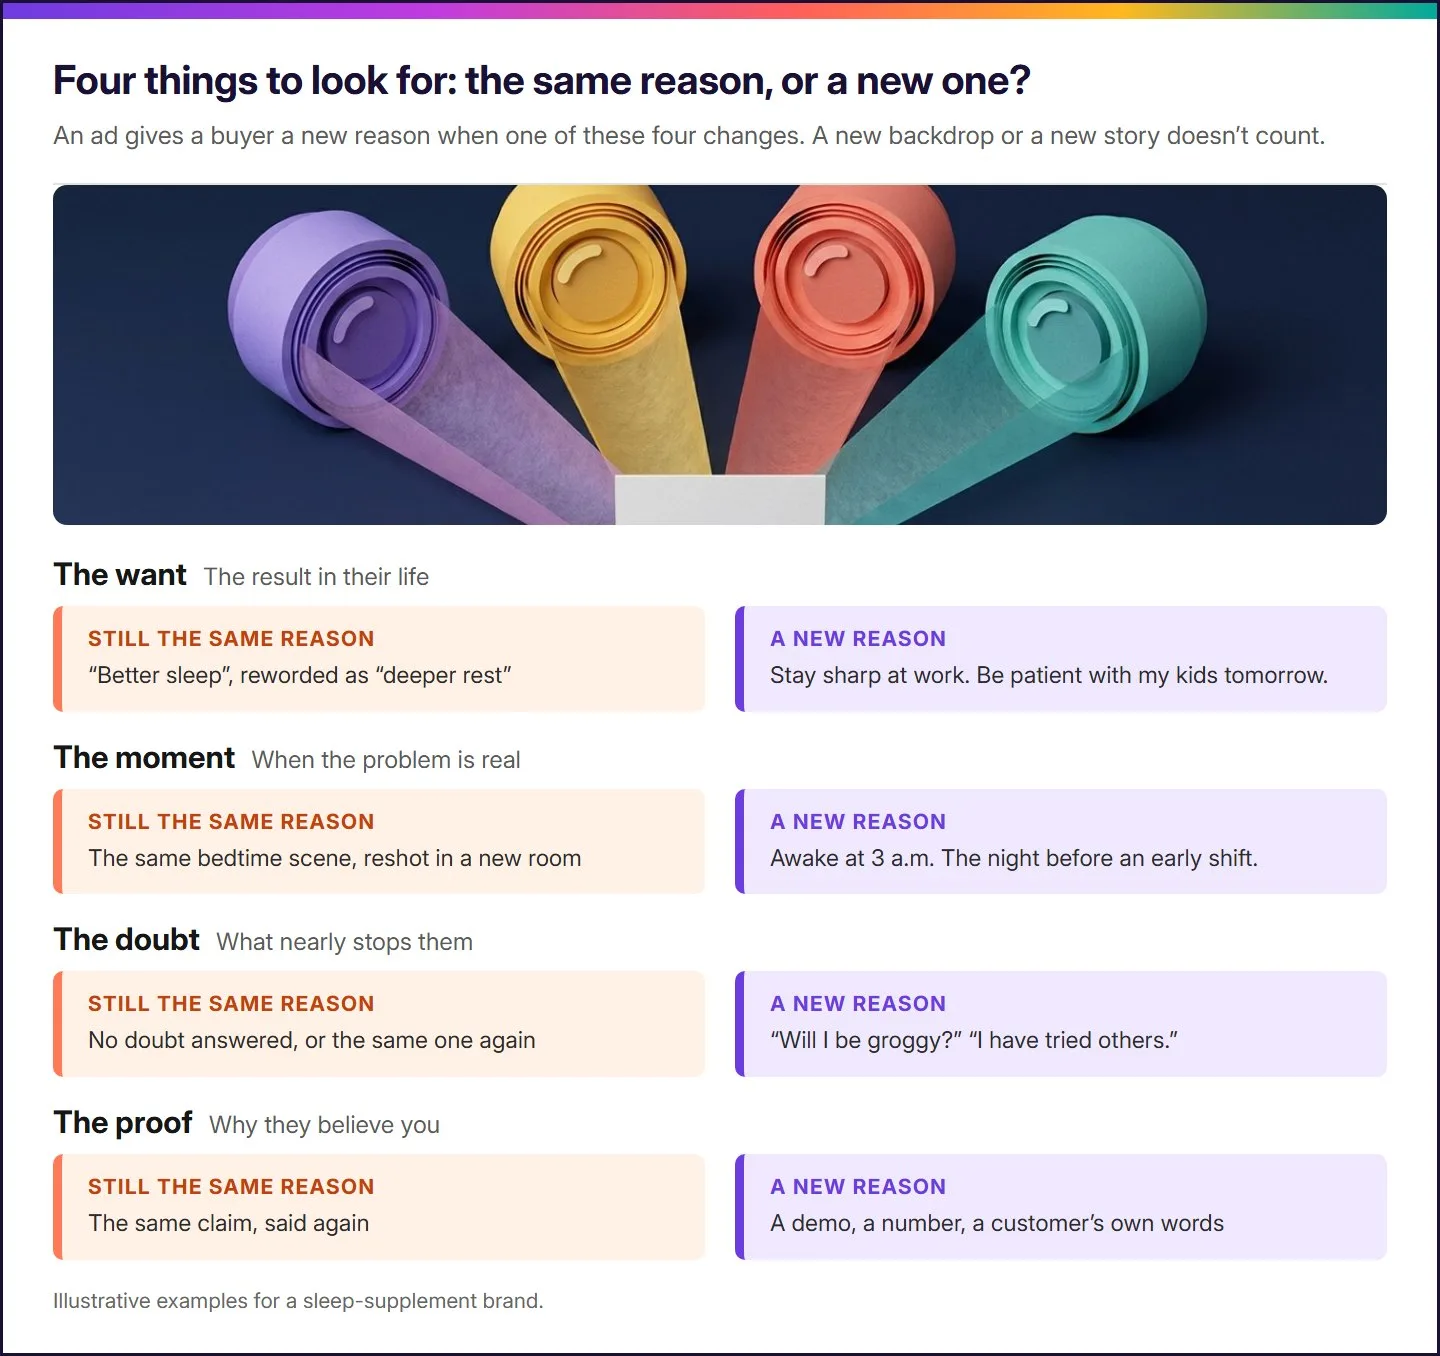
- The want. Not the product benefit, the result in their life. “Better sleep” is a benefit. “Be patient with my kids tomorrow” is a want.
- The moment. When the problem is real: 3 a.m., the night before a shift.
- The doubt. What nearly stops them. “Will I be groggy?” “I’ve tried others.”
- The proof. What makes them believe you. A demo, a number, another customer’s words. In a survey of 1,110 Indian shoppers, 75% said they read reviews before buying.
Where a brand has sales data, Galvor checks the pattern against it. It ranks the brand’s ads by real sales, compares the winners with the losers, and keeps a pattern only if it shows up again and again. When its “scale this” calls were checked later against real results, 81.5% held up.
Here is what that looks like. For a family nutrition brand, the winning ads shared four plain things: they opened on the pack, a parent talked at home, the brand was named in the first 10 seconds, and they ran about 25 seconds. Those ads brought 74% more revenue per rupee than similar ads. None of the four is a format or a story.
Galvor says what the winners shared. It doesn’t claim one thing caused the win.
The fix is usually smaller than you think
Sam didn’t need a sixth founder story. The fix was that one line about grogginess, added in the first three seconds of two of the new ads. Plus one new ad for a buyer nobody had spoken to. A few hours of editing, not a new shoot.
The shift for marketers and leaders
Five things, whatever tool you use.
- Add the reason to every ad. Next to the format and the story, write down the want, the moment, the doubt and the proof. If you can’t fill one in, that’s the gap to fix.
- Read the comments before the dashboard. The dashboard tells you which ad won. The comments tell you why.
- Change one of the four at a time. “Make it like the kitchen-table ad” copies the story. “Same buyer, same doubt, new moment” gives you a test you can learn from.
- Treat it as a guess until it repeats. Ad platforms show each ad to a different mix of people, so one result can mislead. Call a pattern proven only when it shows up again.
- Talk about the moment, not the person. Meta’s ad rules allow “New diabetes treatment available” and reject “Do you have diabetes?”.
Next issue: Creative Fatigue: When to Refresh, When to Cut
Every ad gets tired. Next time, we show how to tell an ad that is fading from one that never got a fair chance, and what to change first.
How we did this
Galvor’s findings come from two places. The 7,854 comments are from our published research on one brand’s public posts; that brand is not a Galvor client. The skincare findings are from Galvor’s work with a brand in India, which is not named: 14,700+ comments, and 280 of its own Instagram posts over a year, measured in engagements per 100 views against the account’s usual 0.98. That is engagement, not sales, and we say what the stronger posts shared, not what caused the result. The same brand’s ads lead on aspiration: 38% of its hooks sell one, across 1,200+ ads. The family nutrition figures are from Galvor’s work with another brand in India, also not named: revenue per rupee spent, against similar ads, for 26 ads from 23 creators. In one three-week stretch in September that formula did 3% worse, so formulas get re-checked as new results come in. The 81.5% is the share of Galvor’s “scale this” calls that held up when checked later against real results.
The research line comes from a 2022 review of 702 studies covering more than 200,000 people. It found that messages matched to what people want persuade more, and most of all when they match the person’s situation. These were experiments, not Meta ads. The “95%” line is from a 2003 Harvard interview, where the figure is given as “95 percent of all cognition”. The car study covers more than 2,000 TV ads for 144 car models. The “reptile brain” idea is called “long discredited among neurobiologists” in a 2020 paper.
What the tools tag comes from each vendor’s own help or product page, read on 15 November 2026: Atria, Motion and Foreplay. Motion’s benchmark is its own data; it counts an ad as a winner when it gets at least ten times its account’s usual spend. The reviews figure is from InMobi’s survey of 1,110 consumers, run 7 to 11 August 2026. Sam, the sleep brand and the first three images are made up for this issue. The ad frames were generated with AI by Galvor, and the person in them is fictional.
Sources
Galvor (2026), Research: how brands are advertising, read from their own ads
Joyal-Desmarais et al., Psychological Bulletin (2022), Appealing to motivation to change attitudes, intentions, and behavior
HBS Working Knowledge (13 Jan 2003), The Subconscious Mind of the Consumer (And How To Reach It)
Guitart and Stremersch, Journal of Marketing Research (2020), The Impact of Informational and Emotional Television Ad Content on Online Search and Sales
Cesario, Johnson and Eisthen, Current Directions in Psychological Science (2020), Your Brain Is Not an Onion With a Tiny Reptile Inside
Atria help centre, Find winning ad formulas with Raya’s AI creative tagging; Motion help centre (3 Apr 2026), Getting started with AI Tagging in Motion; Foreplay, Lens creative analytics
Motion (2026), Creative Benchmarks 2026, 578,750 creatives, 6,015 advertiser accounts
American Marketing Association (7 Jan 2025), Can You Trust Your Ad Data?, on Braun and Schwartz, Journal of Marketing
Indian Television (24 Sep 2026), InMobi finds festive shoppers prioritise trust over discounts in 2026
Meta Transparency Center, Privacy violations and personal attributes
Previously in Decoded: Issue #4, We Shortlisted 20 Creators. The Brand Picked One.